Link to Lecture 3 & 4 slide show: 3&4_properties.pdf
Units; pressure and depth; temperature, heat, and potential temperature; salinity
and conductivity; density, potential density, and neutral density; speed of sound.
1. Difference between accuracy and precision, and units used in oceanographic measurements:
- Accuracy and Precision: accuracy is the ability to measure compared with an absolute standard, while precision is the ability to measure consistently within a given data set (variance in the measurement itself due to instrument noise). Generally the precision of oceanographic measurements is better than the accuracy. For each type of measurement below, current accuracy and precision expectations are listed.
- Units: officially we should be using mks units for everything. In reality, we often use cgs since our velocities are on the order of cm/sec rather than m/sec. We usually refer to depths in meters, and distances in kilometers. Most publications use decibars for pressure rather than Pascals. We usually use degrees Celsius rather than Kelvin, but care should be taken when doing heat calculations. Salinity officially has no units (see discussion below). In general be careful about units when doing calculations.
2. Pressure and depth:
- Definition: Pressure is the force per unit area exerted by water (or air in the atmosphere) on either side of the unit area.
- Units: The units of force are (mass length / time2) which you can remember from Newton's Law F = ma. The units of pressure are (force / length2) or (mass /[length × time2]).
- cgs: dynes/cm^2.
- mks: Newtons/m2 and 1 Pascal = 1 Newton/m^2.
- Atmospheric pressure is usually measured in bars. 1 bar = 106 dynes/cm2 = 105 Pascal.
- Ocean pressure is usually measured in decibars. 1 dbar = 10-1 bar = 105 dyne/cm2 = 104 Pascal.
- Description: The force due to pressure comes from the difference in pressure from one point to another - i.e. the "pressure gradient force" since the gradient is the change over distance. The force is in the direction from high to low pressure, hence we say the force is oriented "down the pressure gradient". In the ocean, the downward force of gravity is balanced mostly by an upward pressure gradient force. That is, the water is not accelerating downwards - instead it is kept from collapsing by the upward pressure gradient. Therefore pressure increases with increasing depth.The pressure at a given depth depends on the mass of water lying above that depth. (Hydrostatic equation given in class.) If the pressure change is 100 decibars (100 dbar), gravity g = 9.8 m/sec^2, and density is 1025 kg/m^3, then the depth change is 99.55 meter. The total vertical variation in pressure in the ocean is thus from near zero (surface) to 10,000 dbar (deepest). Horizontal pressure gradients drive the horizontal flows in the ocean (which are much much stronger than the vertical flows). The horizontal variation in pressure in the ocean is due entirely to variations in the mass distribution. Where the water column above a given depth (or rather geopotential surface, parallel to the geoid) is heavier because it is either heavier or thicker or both, the pressure will be greater. Note that the horizontal pressure differences which drive the ocean currents are on the order of a decibar over hundreds or thousands of kilometers, that is, much smaller than the change in pressure with depth.
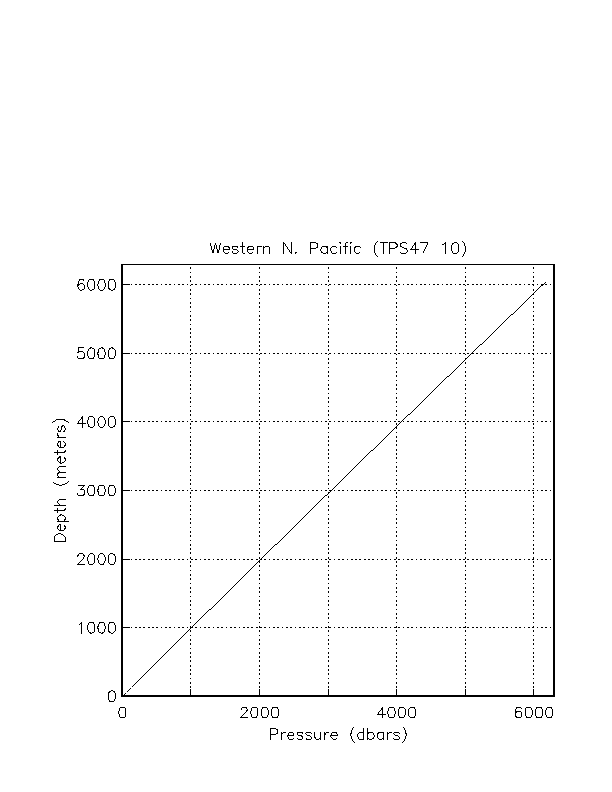
- How is pressure measured? We measure pressure with a Quartz transducer, which has an accuracy of 3 dbar and precision of 0.5 dbar. Click on the link to see the depth vs pressure profile calculated from a CTD cast near Japan.
3. Temperature, heat and potential temperature:
3.1. Temperature:
- Definition: Temperature is a thermodynamic property of a fluid, and is due to the activity of molecules and atoms in the fluid. The more the activity (energy), the higher the temperature. Temperature is a measure of the heat content. Heat and temperature are related through the specific heat: (equation in class). When the heat content is zero (no activity), the temperature is absolute zero (on the Kelvin scale).
- Units: Temperature units used in oceanography are degrees Celsius. For heat content and heat transport calculations, the Kelvin scale for temperature should be used. In the special case when mass transport is zero across the area chosen for the heat transport calculation, degrees Celsius can of course be used. Most oceanographic applications of heat transport rely on making such a mass balance. (See discussion in topic 3). 0°C = 273.16 K. A change of 1°C is the same as a change of 1 K.
- How is temperature measured?
- Using reversing mercury thermometers (see pressure discussion above). These were invented by Negretti and Zamba in 1874. Accuracy is 0.004°C and precision is 0.002°C;
- Using thermistors for electronic instruments, including replacement for reversing thermometer pairs. Quality varies significantly. The best thermistors commonly used in oceanographic instruments have and accuracy of 0.002°C and precision of 0.0005-0.001°C.
3.2. Heat
- Heat per unit volume is computed from temperature using Q = ρ × cp × T, where Q is heat/volume, ρ is the seawater density, cp is the specific heat, and T is temperature in Kelvin (when making a heat calculation in the ocean, where pressure is non-zero, use potential temperature as defined below.) mks units of heat are joules (i.e. an energy unit). Heat change is expressed in Watts (i.e. joules/sec). Heat flux is in Watts/meter2 (energy per second per unit area).
- To change the temperature by 1°C in a column of water which is 100 m thick and 1 m2 on the top and bottom, over a period of 30 days, requires what heat flux? The density of seawater is about 1025 kg/m3 and the specific heat is about 3850 J/(kg C). The heat flux into the volume must then be ρ × cp × ΔT × V/Δt, where T is temperature, V is the volume and t is time. This gives a heat change of 100 W. The heat flux through the surface area of 1m2 is thus 100 W/m2.
3.3. Potential temperature
Pressure in the ocean increases greatly downward. A parcel of water moving from one pressure to another will be compressed or expanded. When a parcel of water is compressed adiabatically, that is, without exchange of heat, its temperature increases. (This is true of any fluid or gas.) When a parcel is expanded adiabatically, its temperature decreases. The change in temperature which occurs solely due to compression or expansion is not of interest to us, as it does not represent a change in heat content of the fluid. Therefore if we wish to compare the temperature of water at one pressure with water at another pressure, we should remove this effect of adiabatic compression/expansion.
Thus, "potential temperature" is the temperature which a water parcel has when moved adiabatically to another pressure. In the ocean, we commonly use the sea surface as our "reference" pressure for potential temperature - we compare the temperatures of parcels as if they have been moved, without mixing or diffusion, to the sea surface. Since pressure is lowest at the sea surface, potential temperature (computed at surface pressure) is ALWAYS lower than the actual temperature unless the water is lying at the sea surface.
4. Salinity and conductivity:
4.1 Salinity:
- Definition: Salinity is roughly the number of grams of dissolved matter per kilogram of seawater. This was the original definition, and at one time salinity was determined by evaporating the water and weighing the residual. The dissolved matter in seawater affects its density (see section 5 below), hence the importance of measuring salinity. The "law" of constant proportions (Dittmar, 1884), formalized the observation that the composition of the dissolved matter in seawater does not vary much from place to place. Why constant proportions? Salts come from weathering of continents and deep-sea vents, etc - the input is very very slow (order 100,000 years) compared with the mixing rate of the whole ocean (which is order 1000 years). Thus it is possible to measure just one component of the dissolved material and then estimate the total amount of dissolved material (salinity). This approach was used until the 1950's. The main constituent of sea salt is Cl, the second largest is Na, followed by many other constituents (see Pickard and Emery for table). In actuality, there is a slight variation in the proportions, and recommendations are underway to formulate new definitions of salinity which depend on the actual constituents - this may likely take the form of geographically-dependent tables of corrections to the quantity which is measured (usually conductivity). The total amount of salt in the world oceans does not change except on the longest geological time scales. However, the salinity does change in response to freshwater inputs from rain and runoff, and freshwater removal through evaporation.
- Units: in the original definition, salinity units were ‰ (parts per thousand). This was replaced by the "practical salinity unit" or PSU. Most recently, the recommendation of the SCOR working group on salinity is that salinity be unitless, as the measurement is now based on conductivity and is not precisely related to the mass of dissolved material.
- How is salinity measured?
- Evaporate and weigh residual, determine amount of chlorine, bromine and iodine to give "chlorinity", through titration with silver nitrate. Then relate salinity to chlorinity, where S = 1.80655 Cl. Accuracy is 0.025 (less than 2 places). This method was used until the International Geophysical Year in 1957.
- Or, measure conductivity and relate it to salinity (see next).
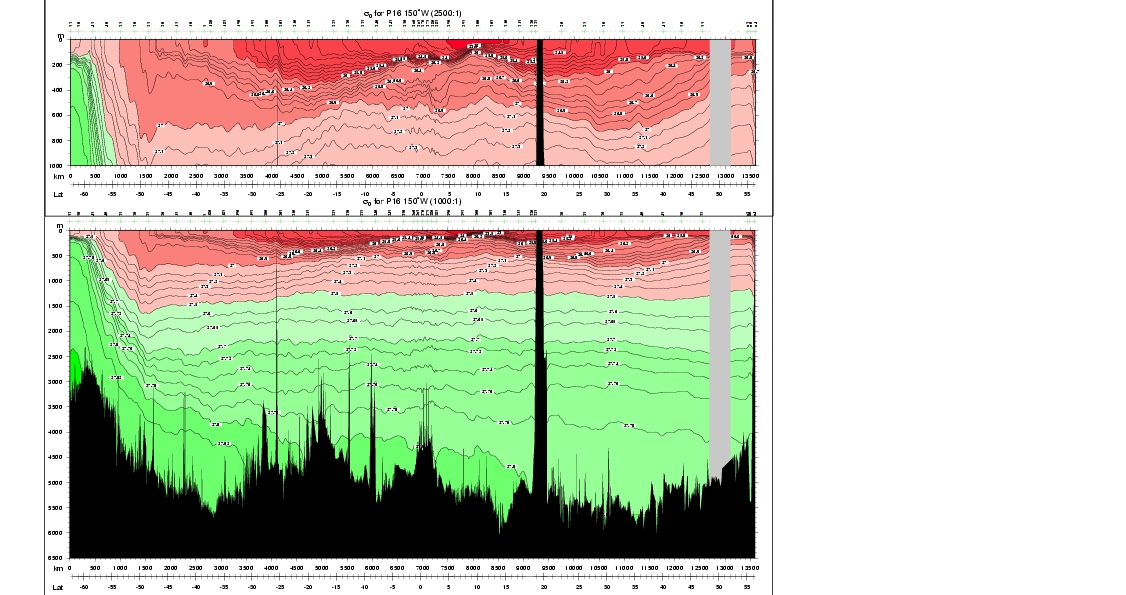
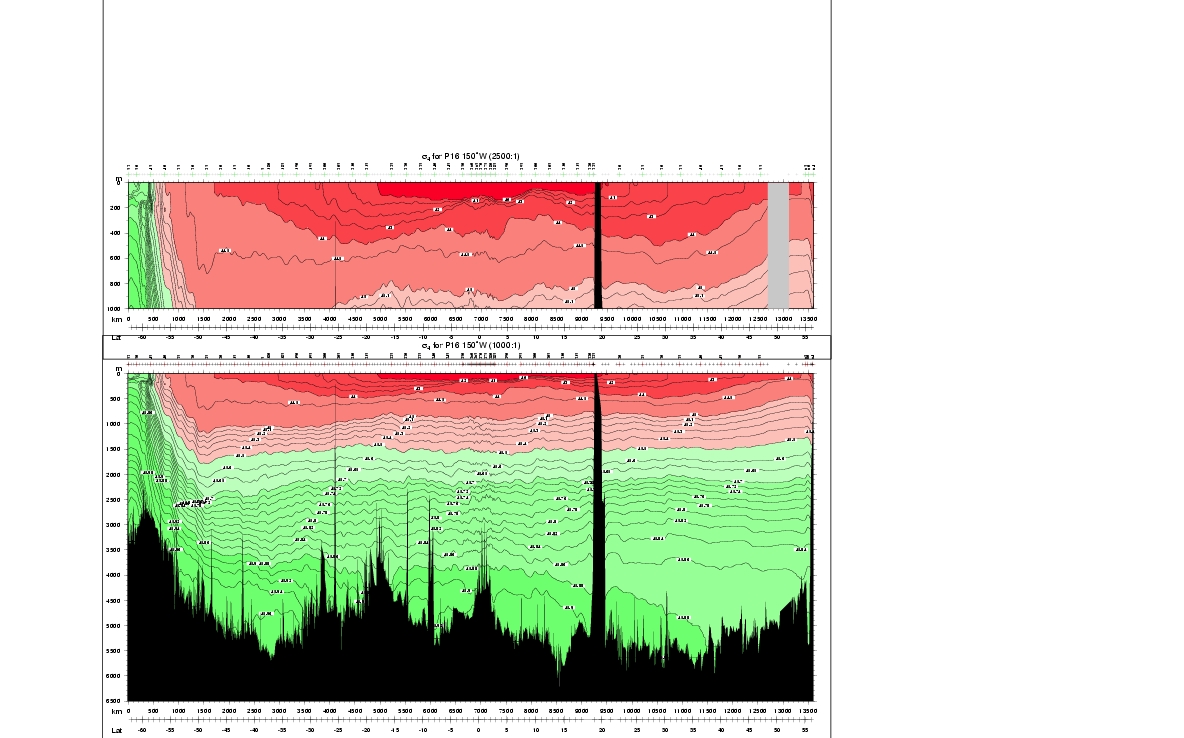
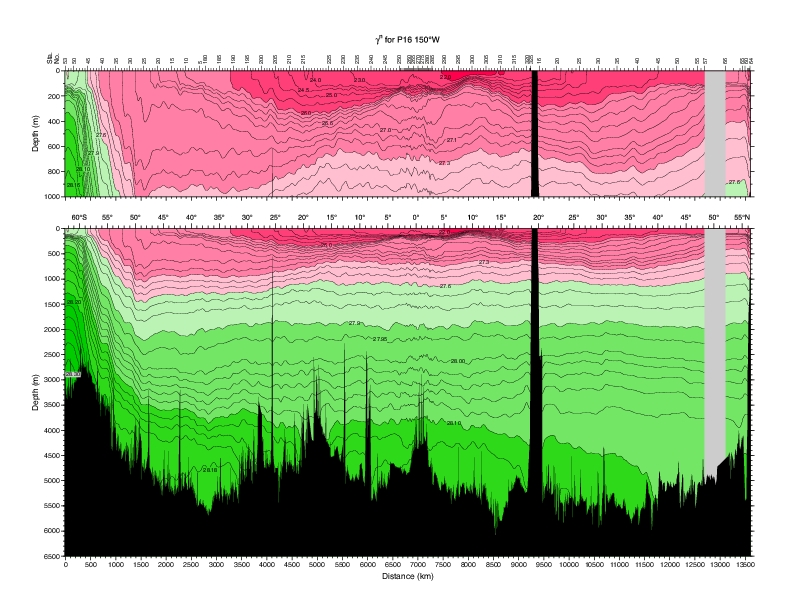
5. Density, potential density and neutral density:
For mapping general circulation, it is more useful to use density (hereafter ρ) as our vertical coordinate than pressure since we assume that water parcels much more nearly conserve density than pressure. Thus we often map properties on isopycnal surfaces. However, the isopycnals which we choose must have the effect of changing pressure removed since most of the density variation in the ocean is due to pressure, which has no bearing on sources of heat/salt for water parcels. Thus we introduce the concept of potential density or neutral surfaces, which attempt to remove the effect of pressure changes on density.
5.1. Density
- Definition: Seawater density depends on temperature, salinity and pressure. Colder water is denser. Saltier water is denser. High pressure increases density. The dependence is nonlinear. An empirical equation of state is used, based on very careful laboratory measurements (See Gill, Appendix 3).
- Discussion:
- The density of freshwater is 1000 kg/m3. Typical densities for seawater are only slightly higher: 1020 to 1050 kg/m3, with most of this range being due to pressure. The range of densities at the sea surface is about 1020 to 1029 kg/m3.
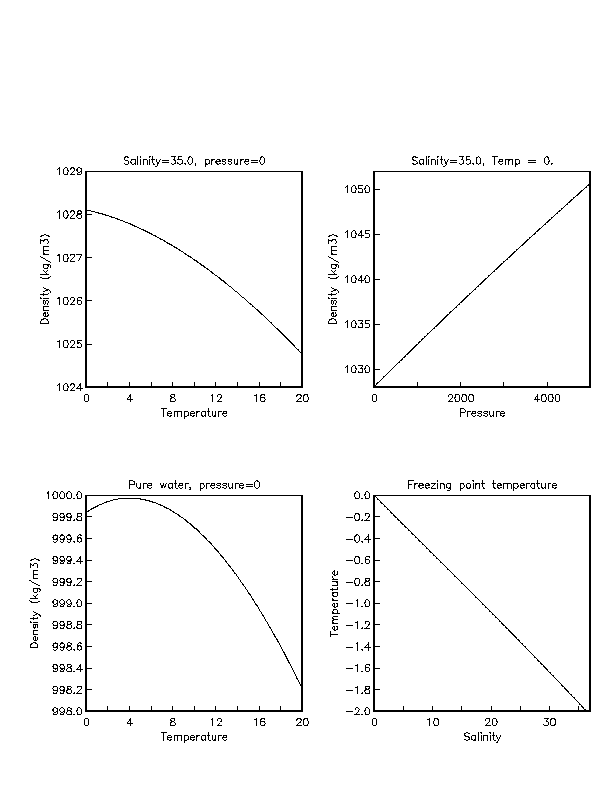
- Density as a function of temperature for pure and salty water: Fresh water (S=0) at atmospheric pressure (p=0) has maximum density at temperature 4°C. (Thus colder fresh water is less dense, which has implications for lake overturn and ice floating.) As salinity is increased, the density maximum moves to lower temperature. At a salinity of about 24.7, the maximum density is at the freezing point.
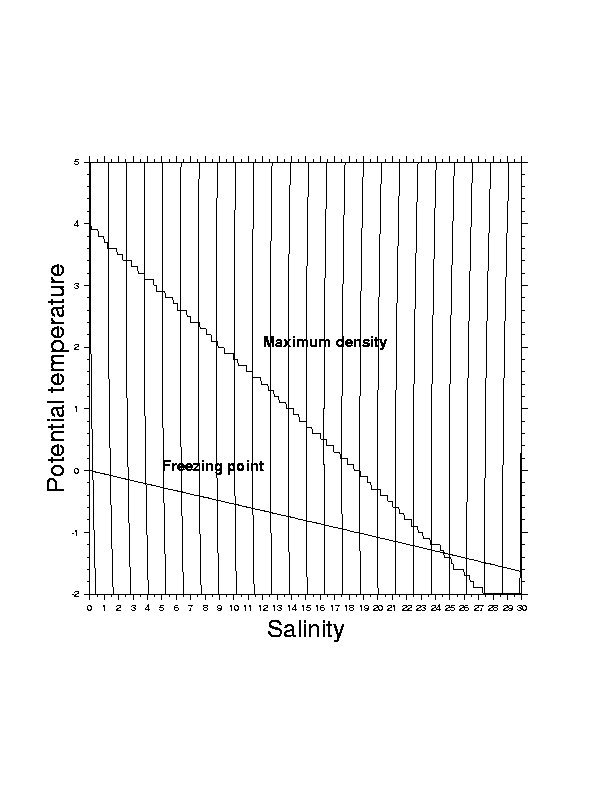
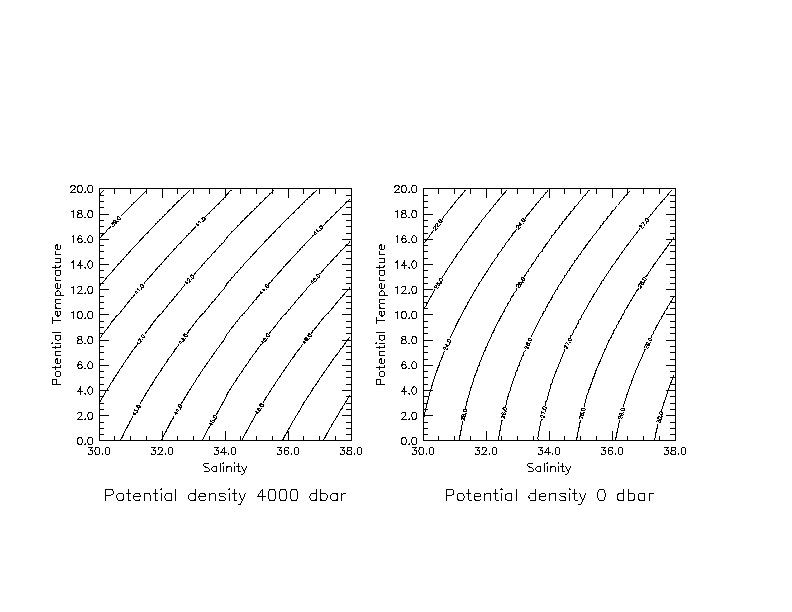
- Density at pressure 0 dbar as a function of temperature and salinity for low salinity: figure show the locus of maximum density and the freezing point. The maximum density curve should be smooth - bumpy because maxima were calculated from a discrete grid with no interpolation.
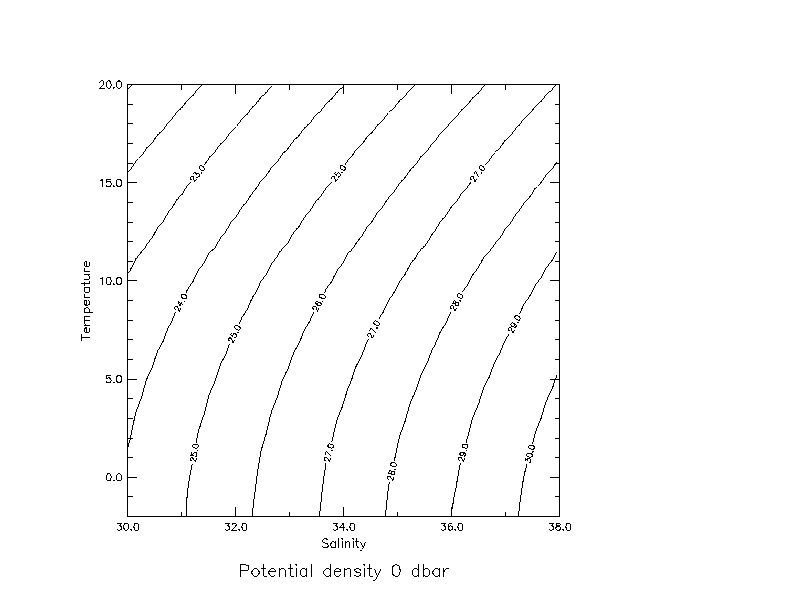
- Density at pressure 0 dbar as a function of temperature and salinity. The non-linearity of the equation of state is apparent in contours of constant density in the plane of temperature and salinity (at constant pressure) - they are curved. They are concave towards higher salinity and lower temperature.
- Other expressions for density ρ:
- σ = ρ - 1000;
- ɑ (specific volume) = 1/ρ.
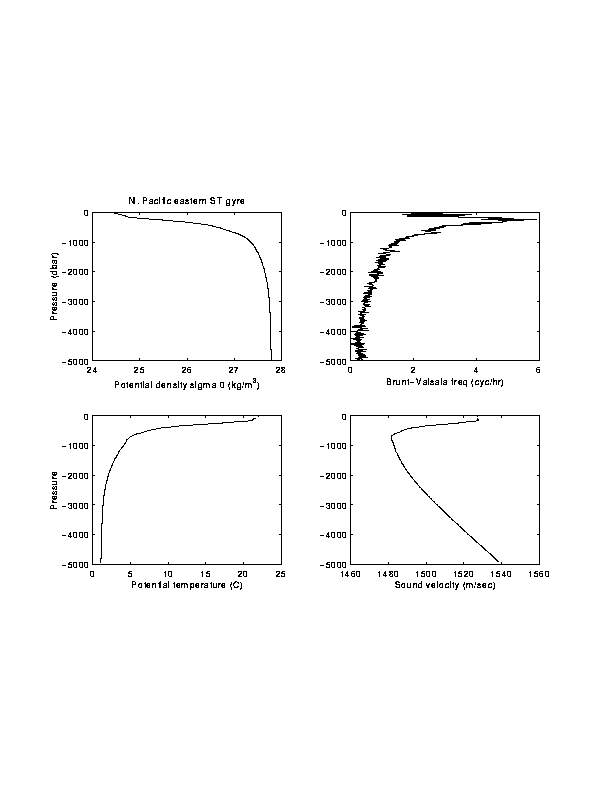
6. Sound speed:
The speed of sound in water is approximately 1500 m/s. It depends on pressure and on temperature. The higher the pressure, the higher the sound speed (in a sense, the water is more "rigid" and so the speed increases). The higher the temperature, the higher the sound speed. In most areas of the ocean, the warm water at the surface and the high pressure at the bottom produce a sound speed profile which is maximum at the surface and bottom, with a minimum in between. This sound speed minimum is referred to as the SOFAR channel. Where temperature is low or inverted near the surface, then there is no surface maximum in sound speed and the SOFAR channel is found at the sea surface (typical of the subpolar and polar regions). Where there is a sound speed minimum, it functions as a wave guide.
Figure. Profiles of potential density, Brunt-Väisälä frequency, potential temperature, sound speed from the eastern subtropical North Pacific.
7. Sea ice:
The freezing point of seawater is lower than that of freshwater. As sea water freezes, it forms pockets of salt. The salt (brine) leaches out of the bottom of the ice and the brine drips into the water below the ice. Thus sea ice when melted is considerably fresher than the original water which was frozen. The "brine rejection" process creates dense water below the sea ice formation area. This can be an important contributor to dense water formation in a global sense as the densest waters are formed at high latitudes, and often involve sea ice. The faster that sea ice is frozen, the less likely that the salt can escape. Thus the saltiest sea ice is formed at the lowest temperatures. Sverdrup et al. (1942 text) tabulate the salinity of ice formed from water which starts at salinity 30. When frozen at an air temperature of -16C, the salinity of the ice is 5.6. When frozen at an air temperature of -40C, the salinity of the ice is 10.2.
Study questions:
- What is the difference between accuracy and precision?
- What properties of seawater determine its density?
- What is the pressure at the bottom of the ocean relative to sea surface pressure? What unit of pressure is very similar to 1 meter?
- What happens to the temperature of a parcel of water (or any fluid or gas) when it is compressed adiabatically? What quantity describes the effect of compression on temperature? How does this quantity differ from the measured temperature? (Is it larger or smaller at depth?)
- What are the two effects of adiabatic compression on density? What quantity is used to minimize the effect of compression on density? Is cold water more or less compressible than warm water?
- What is salinity and why do we use a single chemical constituent (which one?) to determine it? What other physical property of seawater i is used to determine salinity? What are the problems with both of these methods?
- What is an equation of state? What unique properties of seawater arise from non-linearities in the equation of state?
- Why do we use different reference pressure levels for potential density? (see answer to 6)
- What is a neutral surface or path?
- What are the significant differences between freezing pure water and freezing seawater? What happens to the salt in frozen seawater?
- Fresh water has a density maximum at a temperature above the freezing point, which allows ice to float. Is this also true for sea water?
- Why does ice formed from sea water float?
- Why is there a sound speed minimum in the middle of the water column?
Quantitative questions:
A simplified formula for the speed of sound in water is:
C = 1449 + 4.6T - 0.055T2 + 1.4(S-35) + 0.017D (m/s)
where T is temperature (°C), S is salinity and D is depth in meters. Suppose an experiment is set up to measure the mean ocean temperature with a sound source and receiver located 5,000 km apart. Assume the sound path follows a mean depth of 1000m, where the mean salinity is 35 psu. Based on this setting, answer the questions below:
- If the travel time between source and receiver is 56 minutes and 28.25 seconds, what is the mean temperature of the water?
- Suppose the water between the sound source and receiver were to warm by 0.15°C. What would be the change in the acoustic travel time?
- Suppose, instead, that a warm eddy drifted into the sound path. The eddy has a width of 200 km and a temperature anomaly of 1°C at 1000m. What is the change in acoustic travel time?A 5m deep swimming pool is filled with seawater so that the level is 1 cm below the rim (e.g. 4.99 m of water). If the water is well mixed and initially at 10C and 35 PSU. If the water is uniformly heated, how hot would the water be when it started leaking over the rim? How much heat (J/m2) is required to heat the water to this point? If the heating rate is 100 W/m2, how long would this take?
Further reading and resources:Last modified: Sep 2016